
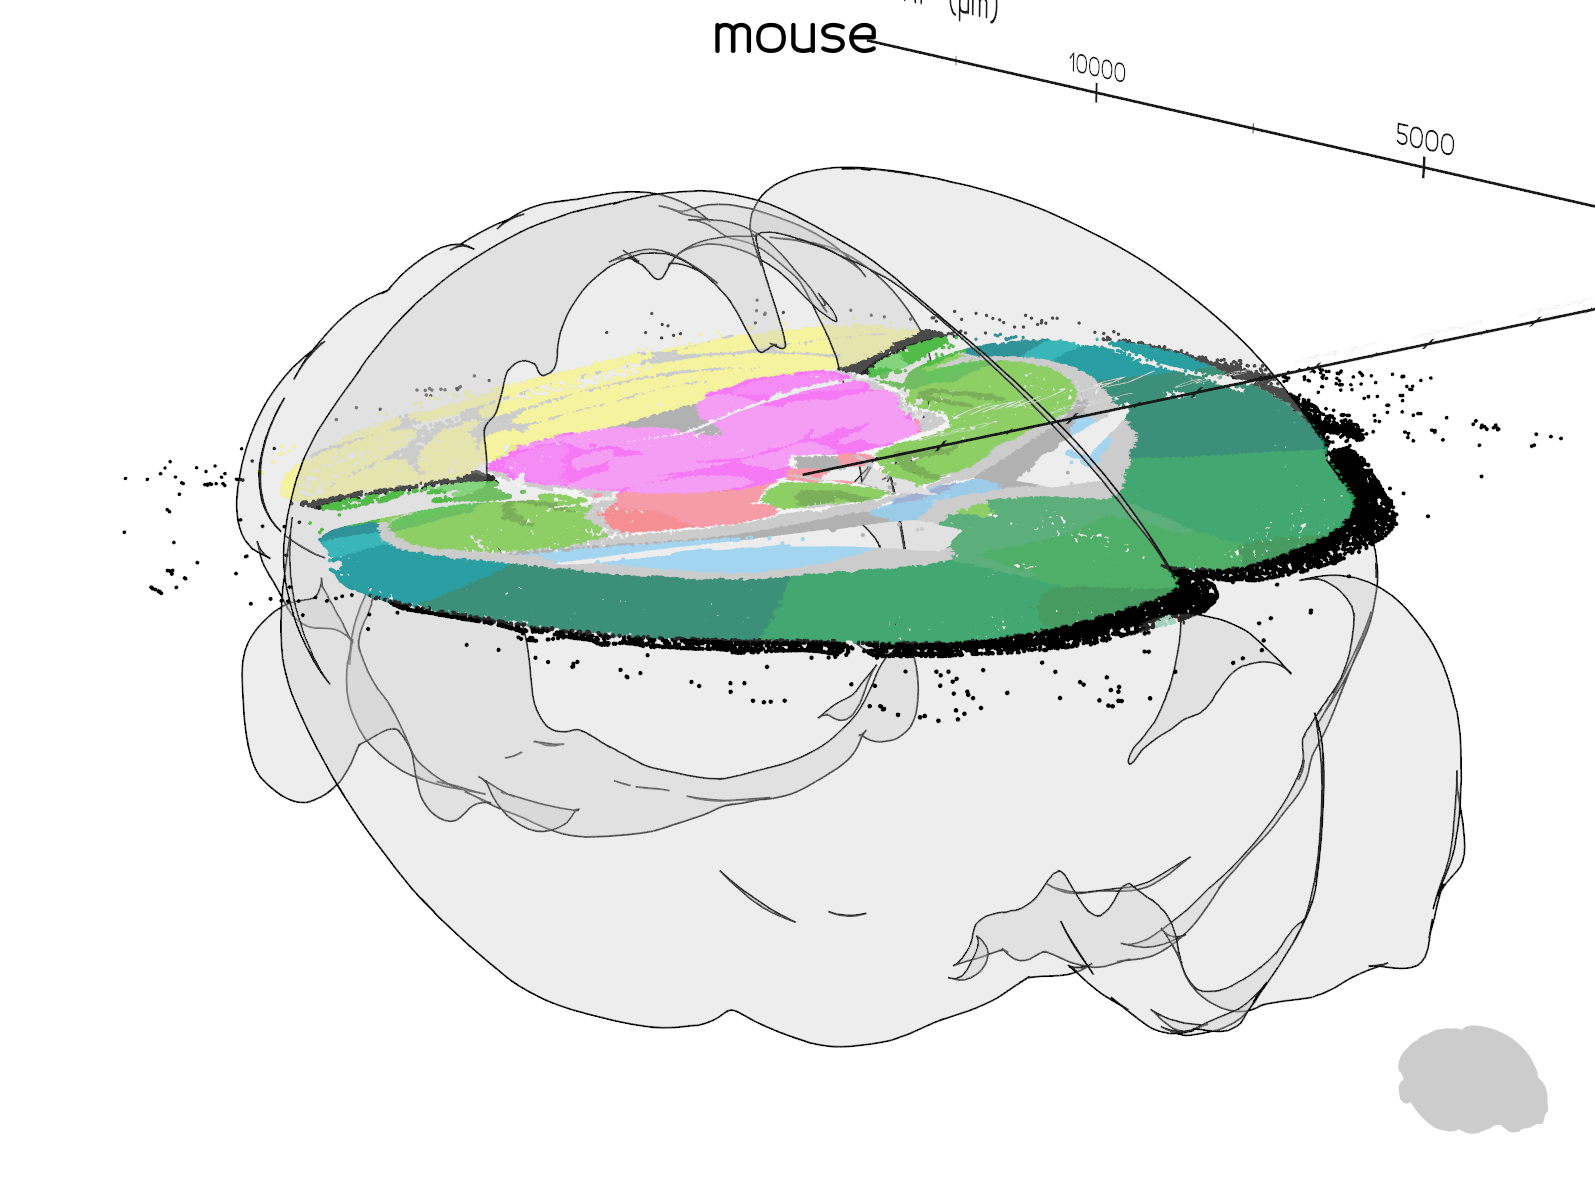
Visualising cells in brainrender#
Plot PyNutil-extracted cell coordinates in a 3D brainrender scene, coloured by atlas region.
Code#
import pandas as pd
from brainglobe_atlasapi import BrainGlobeAtlas
from brainrender import Scene
from brainrender.actors import Points

import PyNutil as pnt


def to_hex(rgb):
    """Convert an RGB triplet (0-255) to a hex colour string."""
    return f"#{rgb[0]:02x}{rgb[1]:02x}{rgb[2]:02x}"


atlas = BrainGlobeAtlas("allen_mouse_25um")

alignment = pnt.read_alignment(
    "tests/test_data/brainglobe_coordinates/registration/brainglobe-registration.json"
)
coords = pnt.xy_to_coords(
    pd.read_csv("tests/test_data/brainglobe_coordinates/coordinates.csv"),
    alignment,
    atlas,
)

# Scale coordinates to atlas resolution (µm)
coordinates = coords.objects.points * 25

# Colour each cell by its atlas region; unlabelled cells are black
colours = [
    to_hex(atlas.structures[i]["rgb_triplet"]) if i != 0 else "#000000"
    for i in coords.objects.labels
]

scene = Scene(atlas_name="allen_mouse_25um", title="mouse")
scene.add(Points(coordinates, name="CELLS", colors=colours))
scene.render()