
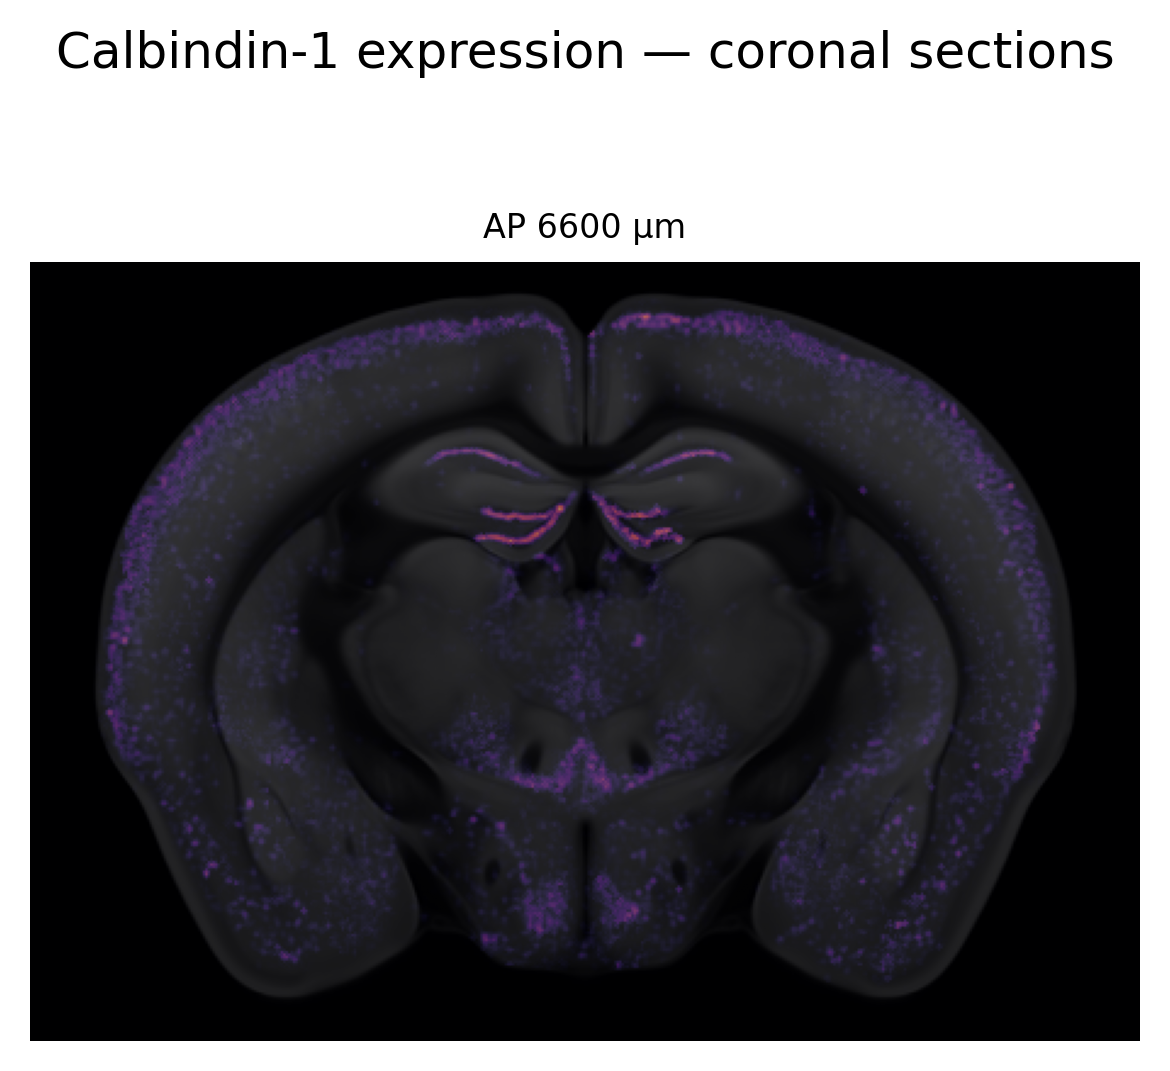
Coronal cross-sections with expression heatmap#
Interpolate pixel values into atlas space with PyNutil, then display a grid of coronal sections with the Allen STPT structural template as background and the expression heatmap overlaid in magma.
Code#
import numpy as np
import matplotlib.pyplot as plt
from brainglobe_atlasapi import BrainGlobeAtlas

import PyNutil as pnt

IMAGE_DIR = "path/to/expression_25um"
ALIGNMENT_JSON = "path/to/alignment.json"

N_SECTIONS = 3

atlas = BrainGlobeAtlas("allen_mouse_25um")
alignment = pnt.read_alignment(ALIGNMENT_JSON)
image_series = pnt.read_image_dir(IMAGE_DIR)

result = pnt.interpolate_volume(
    image_series=image_series,
    registration=alignment,
    atlas=atlas,
    value_mode="mean",
    segmentation_mode=False,
    intensity_channel="grayscale",
    do_interpolation=True,
    return_orientation="asr",
)

expr = result.value.astype(np.float32)
expr = np.nan_to_num(expr, nan=0.0)

# Atlas STPT template — "asr" orientation matches the volume directly
stpt = atlas.reference.astype(np.float32)
stpt /= stpt.max()

n_ap = expr.shape[0]
indices = np.linspace(n_ap * 0.3, n_ap * 0.8, N_SECTIONS, dtype=int)

fig, axes = plt.subplots(N_SECTIONS, 1, figsize=(4, N_SECTIONS * 4), dpi=300)

for ax, idx in zip(axes, indices):
    ax.imshow(stpt[idx], cmap="gray", vmin=0, vmax=1)
    ax.imshow(expr[idx], cmap="magma", alpha=0.6, vmin=0, vmax=expr.max() * 0.8)
    ax.set_title(f"AP {idx * 25} µm", fontsize=8)
    ax.axis("off")

fig.suptitle("Calbindin-1 expression — coronal sections", fontsize=12)
plt.tight_layout()
plt.show()