
Gallery#
A collection of examples demonstrating PyNutil’s capabilities.
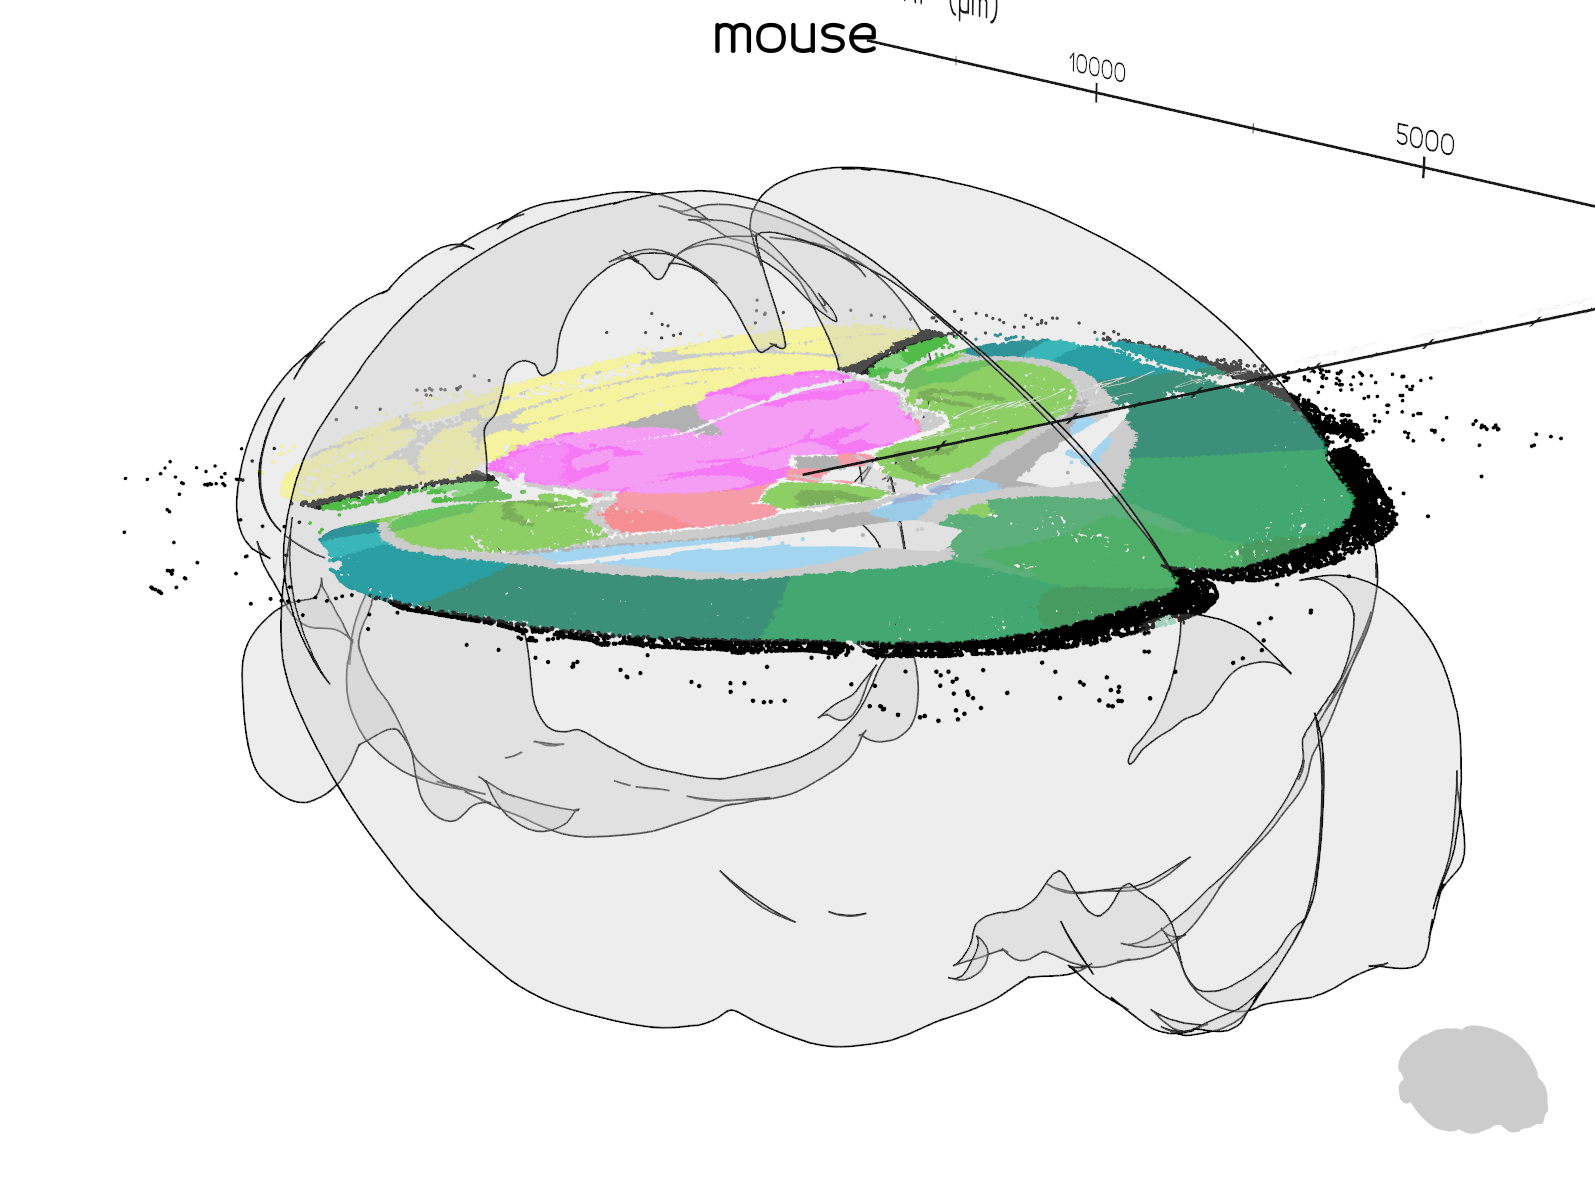
Visualising cells in brainrender
Plot cell coordinates in a 3D brainrender scene, coloured by atlas region.
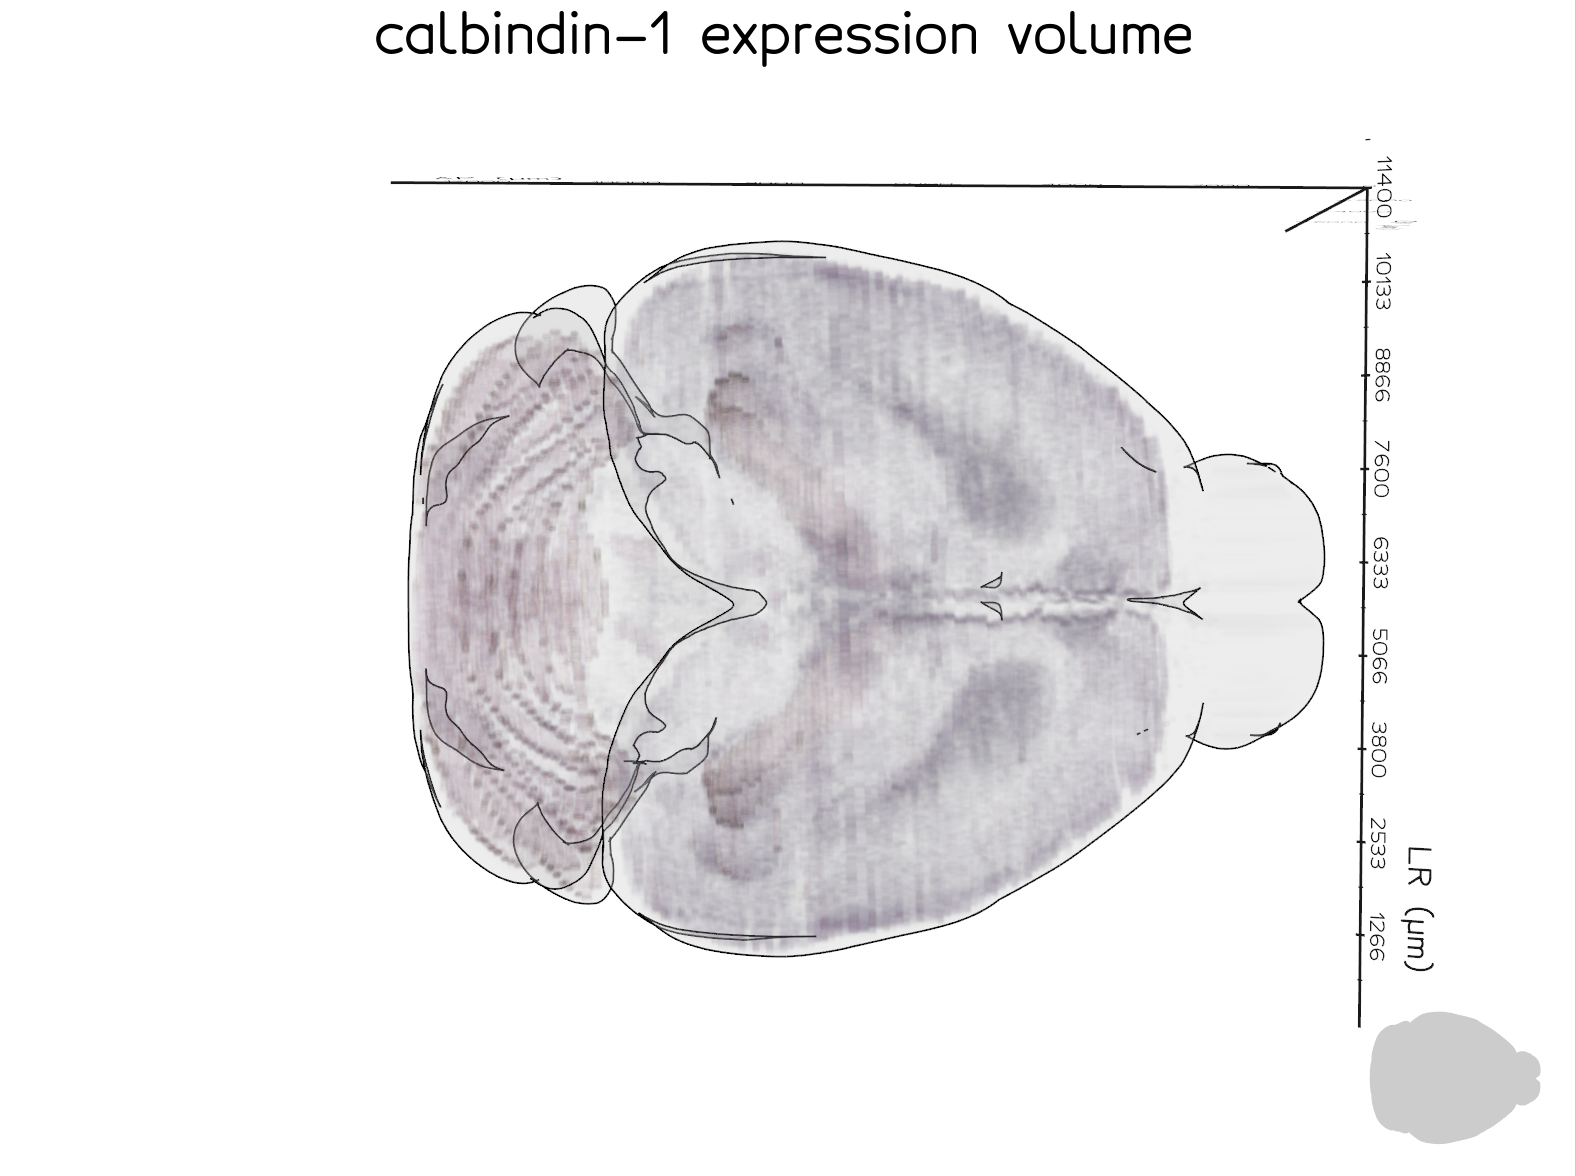
Plotting PyNutil volumes in brainrender
Render an interpolated expression volume as a 3D heatmap directly in brainrender.
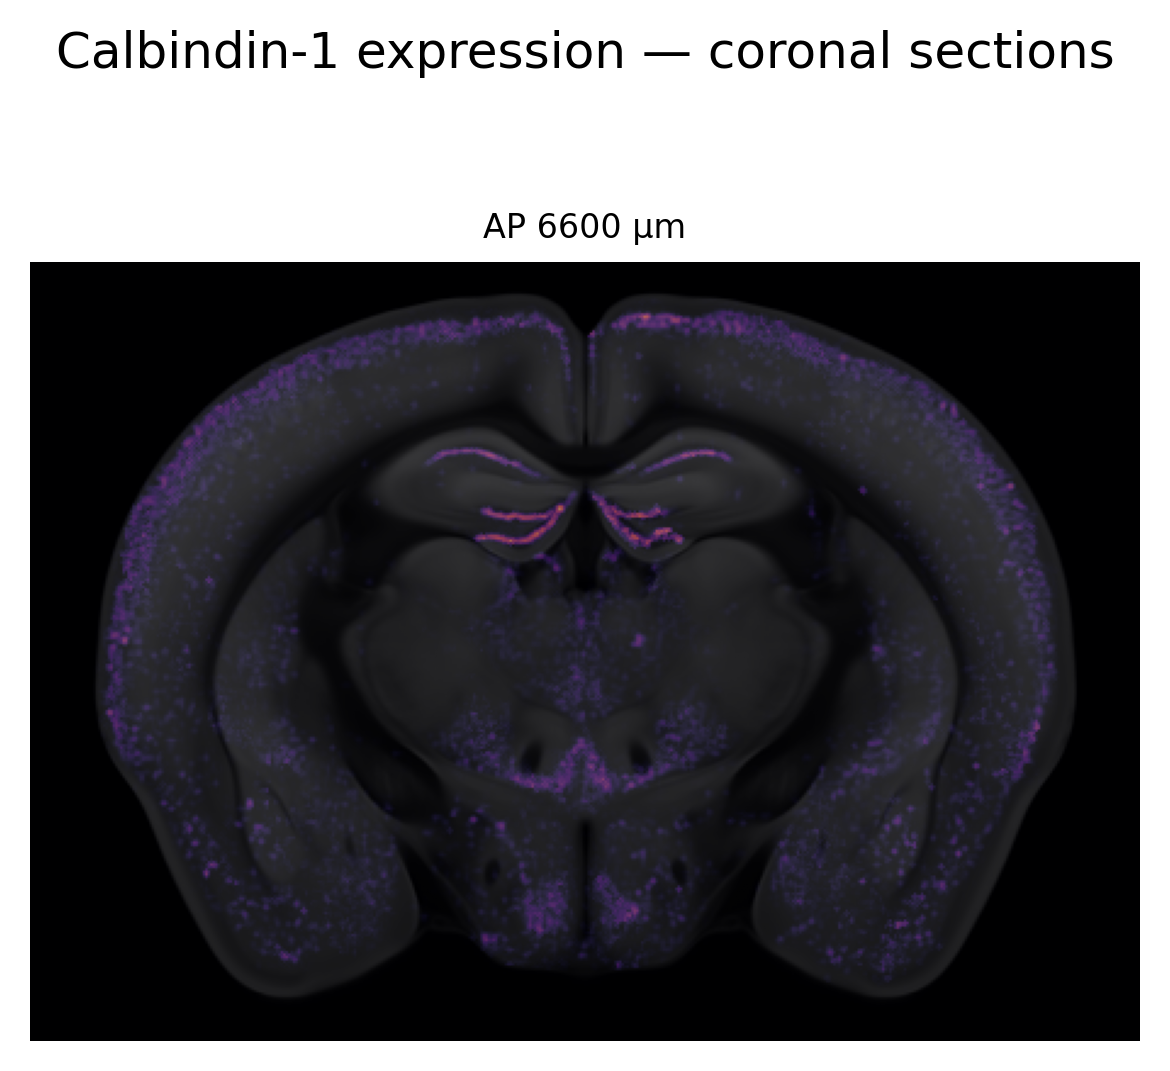
Coronal cross-sections with expression heatmap
Display a grid of coronal sections with the Allen STPT background and a magma expression overlay.